Skip to content
  1. Mathematics
  2. Data
  3. AI
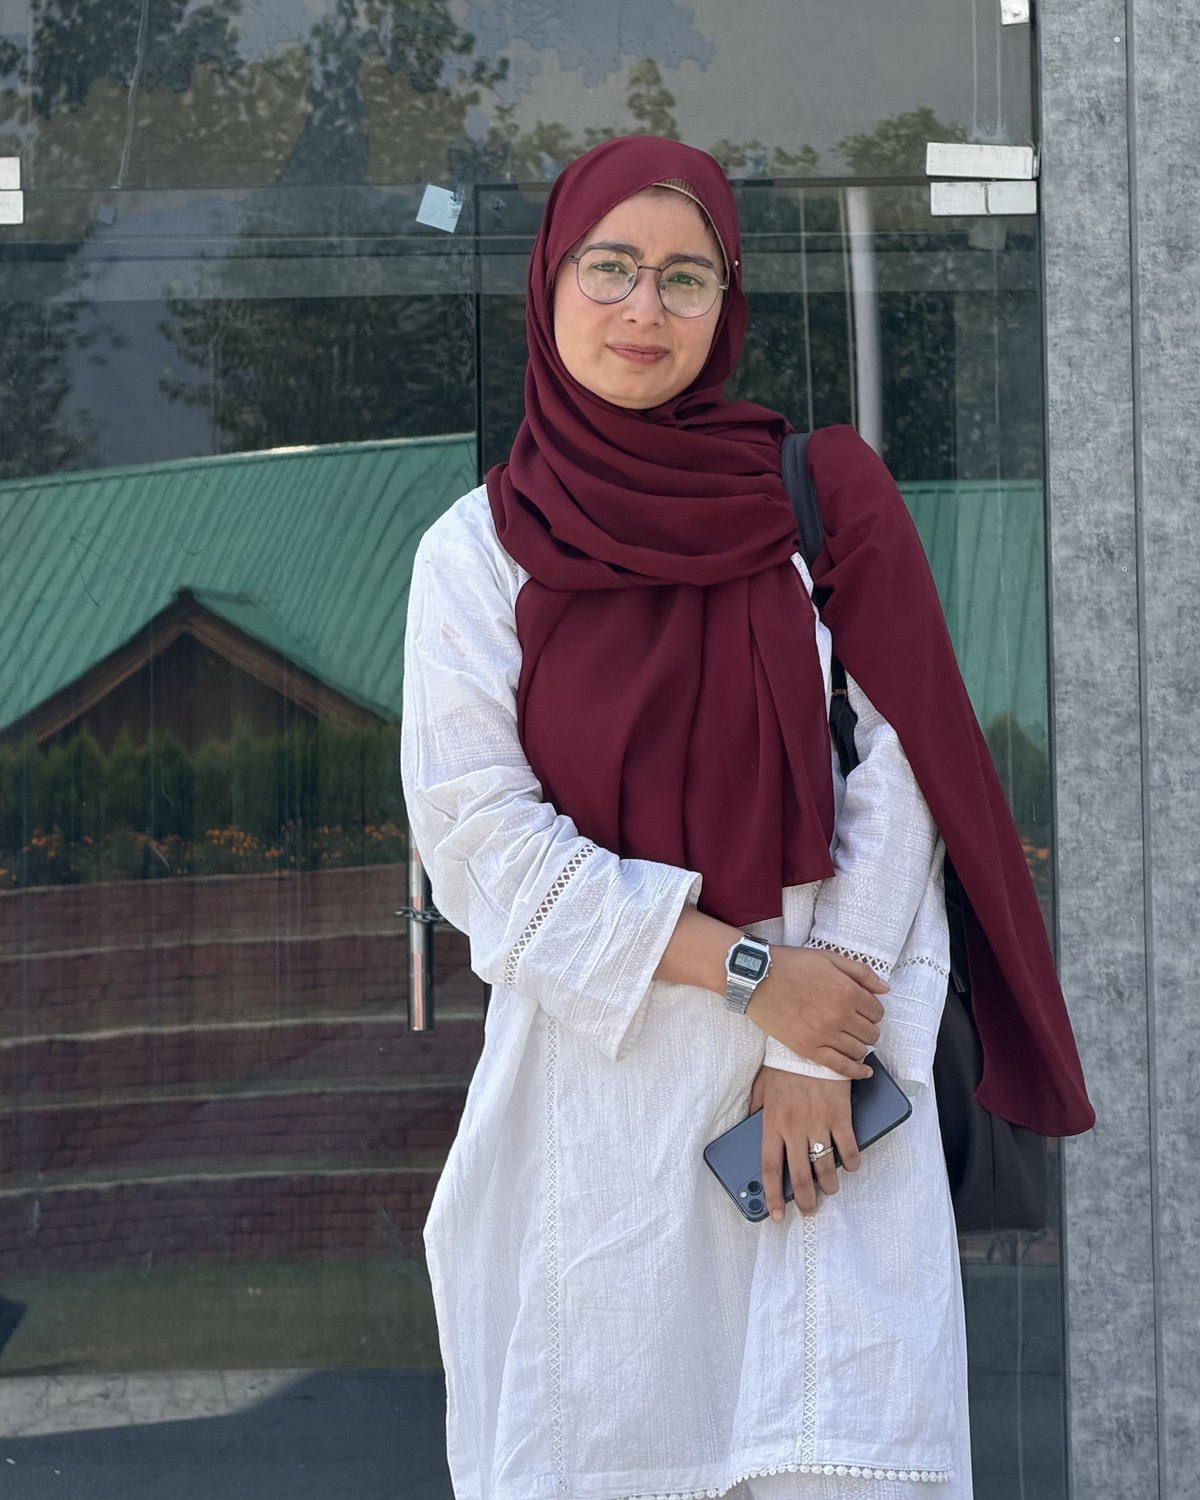
Portrait of Ifrah Rashid

Ifrah Rashid

Mathematics postgraduate building toward deeper work in data science, machine learning, and applied AI.

I work across data analysis, machine learning, AI systems, automation, and technical education — using mathematical thinking to understand problems, data to investigate them, and technology to build practical solutions.

Currently focusing on

Data Science · Machine Learning · Applied AI · Research

01 · Mathematics

Mathematics is where the thinking started.

Five years of mathematics is not a line on a CV — it is a habit of mind. State the problem precisely. Find the structure underneath it. Be explicit about assumptions. Know the difference between a result that holds and a result that merely looks right. Data science asks for exactly those instincts: probability for uncertainty, linear algebra for the shape of data, calculus and optimisation for how models actually learn, and modelling for turning a messy situation into something you can compute with.

What that foundation consists of
Probability
Reasoning under uncertainty
Statistics
Estimation, inference, variance
Linear Algebra
The language of data structure
Calculus
Rates, limits, optimisation surfaces
Optimization
Finding the best feasible answer
Mathematical Modeling
Turning a situation into structure
Numerical Methods
Computing what cannot be solved exactly
Topology & Graph Theory
Structure, equivalence, and transformation
Education
  • M.Sc. Mathematics

    Central University of Kashmir

    2024–2025

  • B.Sc. Mathematics

    Central University of Kashmir

    2020–2024

The mathematics is not the point on its own. It is the reason a dataset, a model, or a business question tends to look like a structure rather than a mystery.

02 · The Transition

Turning mathematical thinking into data-driven work.

The move from mathematics into data was gradual and deliberate rather than a career pivot. Each stage kept the previous one: the analysis is more careful because of the mathematics, and the AI work is more useful because of the analysis.

  1. 01

    Mathematics

    Structure, probability, optimisation — the way the problem is framed before anything is computed.

  2. 02

    Data analysis

    Python and SQL against real datasets: cleaning, validating, exploring, visualising, questioning what the numbers claim.

  3. 03

    Machine learning

    Applying statistical thinking to models — features, fitting, evaluation, and the limits of each method.

  4. 04

    Applied AI

    LLMs, agents, retrieval and automation used to turn analysis into systems that other people can run.

The working stack
PythonSQLPandasNumPySciPyJupyterData VisualizationStatistics

These are the tools the work actually runs on — used against real business data, not only tutorial datasets.

03 · Master's Research

Knot Theory and Its Connections with Graph Theory

A master's-level investigation into how knots can be classified, represented, and translated into graph-based structures — and what those translations reveal about equivalence, invariants, and symmetry.

What the project covered

Studied the foundations of knot theory, from diagrams and Reidemeister moves to knot invariants and coloring theorems. The core thread was the two-way relationship between knots and graphs: how a knot diagram can be encoded as a graph, how graph-theoretic methods can expose knot properties, and how algebraic and topological ideas combine to distinguish one knot from another.

Knot TheoryGraph TheoryTopologyReidemeister MovesKnot InvariantsTricolorabilityMathematical Modeling
Key threads
Classification & invariants
Explored knot equivalence, Reidemeister moves, and invariants used to distinguish knots and analyze their structure.
Knot–graph correspondence
Investigated methods for representing knots as graphs and transforming graph-based representations back into knot structures.
Coloring theorems
Studied tricolorability and related coloring concepts as tools for determining knot properties and detecting differences between knots.
Cross-domain reasoning
Applied ideas from algebra, topology, and graph theory to analyze problems that arise naturally in knot theory.
Visualization
Developed mathematical representations and diagrams to visualize knot structures and demonstrate transformations between representations.

This project is part of why I am comfortable with abstraction. Knots and graphs are different objects, but the work of finding the right representation, proving equivalence, and extracting an invariant is the same discipline I now apply to data and models.

Capstone Project · Jan–Apr 2026

Customer Segmentation Through Comparative Clustering

How can customer behaviour be turned from raw transactional data into segments a business can actually act on?

The interesting part of this project was not running a clustering algorithm. It was deciding what a segment should mean, choosing between four methods that disagree, and getting from a cluster label to something a business can do on Monday morning.

01

The Data

The project started with real-world retail transaction data — the kind that arrives inconsistent rather than analysis-ready. Before any modelling, the work was cleaning: resolving missing and malformed records, removing cancellations and invalid quantities, standardising customer and product identifiers, and checking that totals reconciled. Exploratory analysis then described the shape of the customer base: how purchase value distributes, how often customers return, and how heavily the data skews toward a small group of frequent buyers.

02

Feature Engineering

Raw transactions do not describe customers — they describe events. RFM converts an event log into a behavioural profile per customer, which is what the clustering algorithms actually need. Skewed monetary and frequency distributions were transformed and scaled so that distance-based algorithms would not be dominated by a handful of extreme spenders.

  • R

    Recency

    How long since this customer last purchased?

  • F

    Frequency

    How often do they come back?

  • M

    Monetary

    How much value have they contributed?

03

Model Comparison

Rather than assuming one algorithm was correct, four were fitted to the same feature space and treated as four competing answers to the same question. Each carries a different assumption about what a 'segment' is — and those assumptions, not the code, are what decide the result.

K-Means

Assumes
Segments are compact, roughly spherical groups of similar size.
Strength
Fast, interpretable centroids that map cleanly to customer profiles.
Limit
Forces every customer into a group; sensitive to scale and outliers.

Hierarchical Clustering

Assumes
Customers nest — small groups merge into larger ones.
Strength
A dendrogram shows structure at several levels before k is fixed.
Limit
Costly on large data; merges cannot be undone once made.

DBSCAN

Assumes
Segments are dense regions; sparse points are noise.
Strength
Finds irregular shapes and explicitly isolates atypical customers.
Limit
Highly sensitive to eps and min_samples in varying-density data.

Gaussian Mixture Models

Assumes
Customers are drawn from overlapping probability distributions.
Strength
Soft assignment — a customer can partially belong to two segments.
Limit
Assumes Gaussian components; needs more data to estimate reliably.
04

Evaluation

Unsupervised learning has no ground truth, so the comparison relied on internal validation indices read together rather than any single score. Each measures a different property of a partition, and a model that wins on one can lose on another — which is exactly why more than one was used.

  • Higher is better

    Silhouette Score

    How well each point sits inside its own cluster versus the nearest other one.

  • Lower is better

    Davies–Bouldin Index

    Average similarity between each cluster and its most similar neighbour.

  • Higher is better

    Calinski–Harabasz Score

    Ratio of between-cluster dispersion to within-cluster dispersion.

No single index decided the result — the three were read together, and against whether the resulting groups made business sense.

05

Interpretation

A cluster label is not an insight. The final step was reading each group's RFM profile back into plain business language, so that a retention or marketing decision could actually follow from it.

  • RETAINHigh value, still activeProtect the relationship — these customers carry disproportionate revenue.
  • RE-ENGAGEPreviously active, now lapsingReach out before the gap becomes permanent churn.
  • NURTURERecent, low frequencyBuild the habit — turn a first purchase into a second.
  • REWARDFrequent and loyalRecognise loyalty; test advocacy and referral programmes.

Model output and insight are not the same object. The clusters were the halfway point; the segments above are what a retention or loyalty decision can be built on.

06

What I Learned

  1. 01

    Comparing models taught me more than tuning one. The disagreements between algorithms were the most informative part of the project.

  2. 02

    Feature engineering decided the outcome more than algorithm choice did — RFM and the transformations applied to it shaped every partition that followed.

  3. 03

    Clustering quality has to be argued, not asserted. Reading three indices together, and against the business meaning, was more honest than optimising one number.

  4. 04

    Unsupervised results are hypotheses about structure, not answers. Interpretation is where the data science actually happens.

  5. 05

    Translating a cluster into a decision someone can act on is a separate skill from producing the cluster — and the one that makes the work useful.

04 · Real-world data

Working with data beyond the notebook.

Tutorial datasets are clean. Company data is not. This is where the analysis has consequences: reporting that people rely on, dashboards used to talk about revenue, and databases that have to stay correct.

Junior Data Scientist / AI Specialist

FigOutLabs

January 2026 · Remote, India

Working with real operational and business data: writing and optimising SQL and Python to retrieve, clean, transform and validate structured datasets, and building AI-powered automations on top of them.

  • Wrote and optimised SQL and Python queries to retrieve, clean, transform and validate structured datasets for reliable downstream reporting.
  • Performed exploratory data analysis, preprocessing and data-quality checks with Python, Pandas and SQL.
  • Identified patterns, anomalies and actionable insights in business data; produced graphs and visualisations for revenue and operations analysis.
  • Handled company databases and day-to-day data operations work.
  • Built AI-powered automations and intelligent workflows with n8n, APIs and LLMs to remove repetitive internal processes.
  • Developed and tested AI agents for customer support, task management, data processing and information retrieval, grounded in company knowledge, with automated escalation workflows.
  • Collaborated on end-to-end data science and AI projects for US clients — from data preparation and experimentation through solution development, testing and deployment.

What that work looks like

The analysis path
  1. 01Raw data
  2. 02Clean
  3. 03Validate
  4. 04Explore
  5. 05Visualize
  6. 06Interpret
  7. 07Support decisions
The automation path
  1. 01Data
  2. 02AI
  3. 03Automation
  4. 04Operational impact
05 · Applied AI

Building useful AI, not just talking about it.

An operations system built with n8n, APIs and LLMs, sitting on top of the tools a team already uses. The interesting constraint was not the model — it was mapping a messy human process onto something that could run without supervision, and knowing where it must hand back to a person.

n8nAI AgentsLLMsPlaneSlackAPIsWorkflow Automation
Bug-to-task lifecycle
  1. 01Issue reported
  2. 02AI / workflow processing
  3. 03Task created
  4. 04Routed
  5. 05Status updated
  6. 06Team notified

Task creation, bug reporting, issue routing, status updates and internal notifications were automated across 5+ repetitive workflow steps, and consolidated into one centralised workflow.

Customer support agent
  1. 01Customer enquiry
  2. 02Knowledge grounding
  3. 03Classification
  4. 04Routine response — or escalation

An AI support agent grounded in company knowledge handles routine enquiries, classifies incoming requests, and escalates anything urgent or complex rather than guessing.

Reported impact
~5 min → <1 min

Per issue, bug-to-task lifecycle

~80%

Estimated reduction in manual processing time

estimated
~60%

Estimated reduction in first-level manual support workload

estimated
8+ hrs / week

Estimated repetitive operational work saved

estimated

Figures marked estimated are internal estimates from observed workflow times, not formally measured benchmarks.

06 · Systems

From idea to something people actually use.

Virtualyyst Hub is an employee operations platform: employee records and workforce information in one place, with the recurring HR processes around them digitised. It is not a machine learning project — its value is that it went from an operational complaint to a system the company now uses every day.

What it does
  • Centralised employee records
  • Centralised workforce information
  • Recurring HR operations
  • 5+ digitised employee-management workflows

Built with AI-assisted development, which is what made a single-person build realistic — the harder work was structuring the information and deciding which workflows were worth digitising first.

Impact
~50%

Reduction in estimated administrative handling time

estimated
~10 min → <5 min

Average workflow time

In daily use

Actively used by the company for employee management

  1. 01

    Problem

  2. 02

    System

  3. 03

    Adoption

  4. 04

    Impact

07 · Teaching

I like understanding things well enough to explain them.

One of the things I enjoy most about technology is making complicated ideas understandable.

At Chinar Quantum AI
  • Taught and guided more than 10 people through Chinar Quantum AI on data science, AI concepts and practical AI workflows.
  • Introduced people to AI tools and data-driven methods, and helped them apply those tools in their own projects.
  • Supported project-based learning — helping turn ideas into functional projects rather than stopping at theory.
  • Coordinated technical learning and community activities alongside project delivery.
  • Guided people through data concepts and technical problem solving, one problem at a time.
How the loop runs
  1. Learn
  2. Understand
  3. Explain
  4. Build
  5. Teach

I don't see teaching as separate from technical work. If I can explain a difficult idea clearly, I usually understand the idea more deeply myself.

Where this transfers
Technical educationResearch assistanceAI educationMentoringInstructional roles
08 · Leadership

Learning became collaborative.

Led and mentored a 10-member team across AI, data and research projects — coordinating people, priorities and delivery from problem definition through implementation.

Associate Supervisor

Chinar Quantum AI

November 2025
10-member team

Led and mentored across AI, data and research projects

~40%

Reduction in average project turnaround after introducing AI-assisted development workflows

  • 01

    Clarify

    Define the actual problem and what needs to happen before anyone starts building.

  • 02

    Support

    Help people get past technical and execution blockers instead of only tracking them.

  • 03

    Deliver

    Keep projects moving from research through testing and implementation.

  • Led and mentored a 10-member team across AI, data and research projects.
  • Coordinated people, priorities, timelines and project delivery; tracked progress and surfaced blockers early.
  • Oversaw projects from problem definition and research through development, testing, iteration and implementation.
  • Guided fellows in applying AI tools, data-driven methods and rapid development workflows.
  • Introduced AI-assisted development workflows that reduced average project turnaround time by approximately 40%.
  • Coordinated collaborative initiatives, community learning activities and AI solutions for internal and client-facing use cases.
09 · Method

How I approach a problem

Mathematics, research, data science, AI and teaching are not five separate skills here. They are five stages of the same habit.

  1. 01

    Understand

    What is the actual problem?

    Before any method, the problem gets stated plainly — what decision is waiting on this, and what would a useful answer look like.

  2. 02

    Investigate

    What does the available information tell us?

    Explore the data, read what has already been done, and let the evidence narrow the question rather than assuming a direction.

  3. 03

    Model

    Can mathematical, statistical, ML or AI methods help?

    Choose the method the problem justifies — sometimes a distribution and a well-made chart, sometimes clustering, sometimes an LLM.

  4. 04

    Build

    Can the result become a usable system or workflow?

    An analysis that stays in a notebook rarely changes anything. Where it makes sense, the result becomes something people can run.

  5. 05

    Explain

    Can another person understand what happened and why it matters?

    The work isn't finished until someone who wasn't there can follow the reasoning and act on it.

10 · Toolkit

What I work with — and how deeply.

Listing a tool says very little. These groups are labelled honestly: foundation is where years of study sit, applied is what current work runs on, and currently developing is exactly what it says.

Mathematics

Foundation
  • Probability
  • Statistics
  • Linear Algebra
  • Calculus
  • Optimization
  • Mathematical Modeling
  • Numerical Methods

Data

Applied
  • Python
  • SQL
  • Pandas
  • NumPy
  • SciPy
  • Jupyter
  • Data Visualization
  • EDA

Machine Learning

Currently developing
  • Regression
  • Classification
  • Clustering
  • Feature Engineering
  • Model Evaluation
  • Predictive Modeling

Artificial Intelligence

Applied
  • LLMs
  • Generative AI
  • Prompt Engineering
  • RAG
  • AI Agents
  • OpenAI APIs
  • Claude

Building

Applied
  • REST APIs
  • Supabase
  • GitHub
  • Claude Code
  • Lovable

Automation

Applied
  • n8n
  • Zapier
  • Make
  • Webhooks
  • API Integration
11 · Research mindset

Curious enough to keep going deeper.

My data science journey is still relatively new, and pursuing it seriously is a deliberate choice. Mathematics gives me the foundation, my current work gives me real problems to apply it to, and I want to keep developing through research, experimentation and hands-on practice rather than through courses alone.

Where I want to go deeper
  • Statistical learning
  • Machine learning
  • Experimentation
  • Mathematical modeling
  • Applied AI
  • Data analysis
  • Research methodology
  • Deeper Python and data science practice

What I’m exploring next

A running list rather than a promise — what currently has my attention outside of work.

  • Deeper machine learning
  • Statistics for data science
  • Experimentation and study design
  • Advanced data analysis
  • Applied research
  • Mathematical approaches to ML
  • AI systems
  • Better ways to communicate technical concepts
12 · Selected work

Three projects, three different kinds of problem.

One machine learning case study, one applied AI system, one product built to solve an operational problem. Together they cover analysis, automation and delivery.

Capstone · Machine Learning

Jan–Apr 2026

Customer Segmentation Using Comparative Clustering

Real retail transaction data taken from cleaning and EDA through RFM feature engineering, a four-way clustering comparison, and evaluation — then translated into four segments a business can act on.

Four actionable segments: Retain · Re-engage · Nurture · Reward

PythonPandasscikit-learnK-MeansDBSCANGMMHierarchical
Applied AI · Automation

2026

AI-Powered Operations & Customer Support Automation

An AI-driven operations system that automates the bug-to-task lifecycle across task creation, routing, status updates and notifications, plus a knowledge-grounded support agent that classifies and escalates.

~5 min → <1 min per issue · est. 8+ hours/week of repetitive work saved

n8nAI AgentsLLMsPlaneSlackREST APIsWebhooks
Systems · Product

2025–2026

Virtualyyst Hub — Employee Operations Platform

An employee management platform that centralises employee records and workforce information and digitises recurring HR operations. Built with AI-assisted development and in active daily use.

5+ workflows digitised · ~10 min → <5 min per workflow

AI-assisted developmentSupabaseREST APIsProduct thinking
Trajectory

Experience timeline

  1. 2020–2024B.Sc. MathematicsCentral University of Kashmir
  2. 2024–2025M.Sc. MathematicsCentral University of Kashmir
  3. 2024–2025Master's ProjectKnot Theory and Its Connections with Graph Theory
  4. 2025Associate SupervisorChinar Quantum AI
  5. 2026Junior Data Scientist / AI SpecialistFigOutLabs
  6. 2026Customer Segmentation CapstoneComparative clustering on retail data
13 · About

A mathematician learning to think in data.

I studied mathematics for five years, and it shaped how I approach almost everything: state the problem precisely, understand the structure underneath it, then work toward an answer you can defend.

Data science is where that way of thinking became practical. Working with real business data — cleaning it, questioning it, visualising it, modelling it — turned abstract probability and linear algebra into decisions someone actually makes. Applied AI came next: LLMs, agents, retrieval and automation are tools I use to turn analysis into systems people can run.

The other half of my work is explaining things. Mentoring a team and teaching people about AI and data taught me that clarity is a technical skill, not a soft one — and that I understand an idea best once I can explain it to someone else.

I'm early in this career, and I'd rather be honest about that than overstate it. What I have is a strong foundation, real applied experience, and a genuine interest in going deeper into statistics, machine learning, research and applied AI.

14 · Contact

Interested in working on a problem with data, mathematics, or AI?

I’m interested in opportunities where I can contribute, learn quickly, and grow deeper into data science, analytics, machine learning, applied AI, or research.

Location
Kashmir, India